Why Student Performance Data Should Drive Every Academic Decision (And How to Actually Do It)
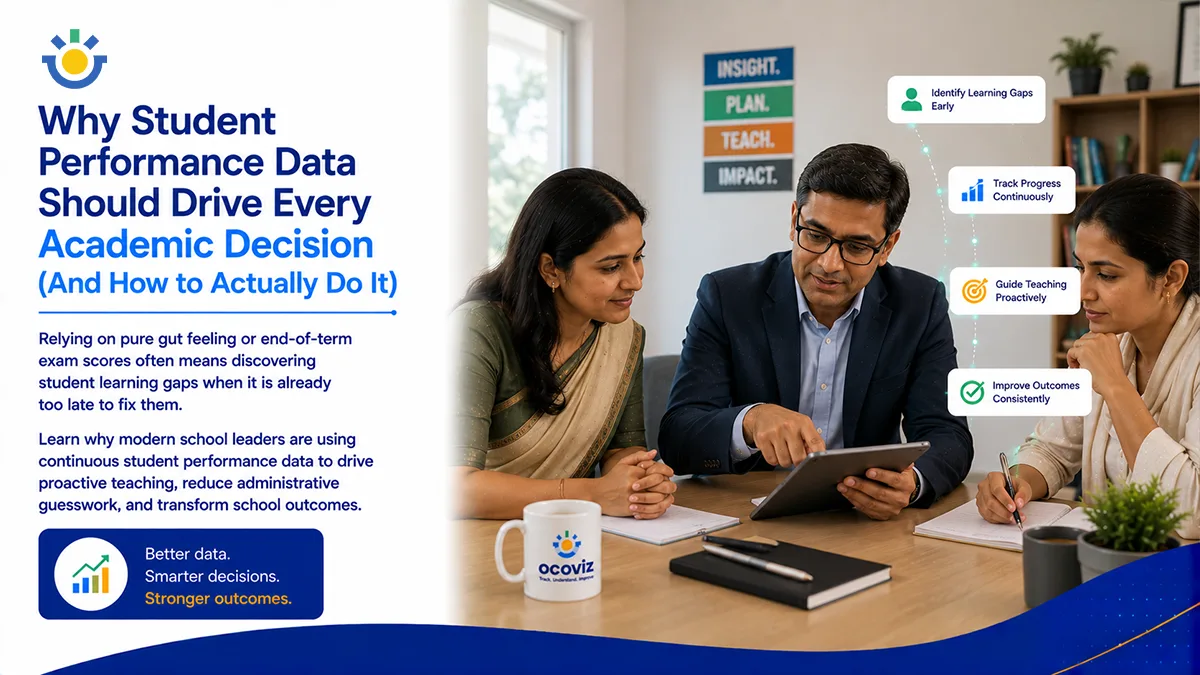
Key Takeaways
- Relying on gut instinct or isolated term-end marks creates systemic delays in addressing student academic struggles.
- Continuous student performance data enables educators to spot subtle conceptual drops weeks before major examinations.
- Data-driven decision-making turns passive records into targeted teaching strategies and personalized student interventions.
- Centralizing student progress metrics reduces administrative friction and eliminates repetitive spreadsheet management.
- An integrated Learning Intelligence Operating System (LIOS) synthesizes daily signals into actionable guidance for principals and teachers.
Every school leader knows the sinking feeling that comes during the mid-year leadership meeting.
You are looking at the latest board exam practice results. The overall pass percentage for 9th-grade algebra has dipped by 14%. Everyone around the table has a theory. The department head blames a tough curriculum pacing schedule. The class teacher thinks the students lost focus after the long holiday break. A senior coordinator suggests adding extra evening coaching sessions.
Everyone is acting in good faith. Everyone cares deeply. But everyone is guessing.
When academic decisions are based on gut instincts, teacher anecdotes, or post-mortem test scores, schools waste precious weeks treating the symptoms instead of the root cause. Was it quadratic equations that tripped them up? Was it a cluster of missed classes in mid-October?
Without continuous data, you aren't leading your institution—you're just navigating it through the dark.
The Direct Answer:
Driving academic decisions with student performance data allows educators to identify learning bottlenecks in real time rather than waiting for term-end results. By tracking continuous signals like daily quiz trends, assignment pacing, and attendance anomalies, school leaders can allocate teaching resources precisely where they are needed most.
The Quick-Scan Parameter:
- Shift from Reactive to Proactive: Catch learning drops 2 to 4 weeks before formal exam dates.
- Eliminate Intuition Bias: Base curriculum changes on multi-dimensional performance trends instead of individual guesses.
- Teacher Time Saved: Reduce hours spent manually compiling marksheets and cross-referencing spreadsheets.
- Unified Stakeholder View: Keep principals, department heads, and parents aligned around identical progress metrics.
What Is the Risk of Relying on Intuition in School Leadership?
Intuition is a powerful human tool, built over years of classroom experience. But intuition alone cannot scale across thirty classrooms, eight subjects, and hundreds of students.
When a school relies purely on traditional, end-of-term grades to evaluate progress, it operates on delayed feedback. A bad exam score tells you that a student failed last month; it doesn't tell you when their understanding broke down or why.
INTUITION-BASED APPROACH: Class Instruction > Final Exam > Delayed Autopsy
DATA-DRIVEN DECISION FLOW: Daily Micro-Signals > Early Trend > Precision Fix
Relying on post-mortem results turns academic leadership into a series of late-stage rescue operations rather than smooth, continuous guidance.
How Does Continuous Performance Data Change Daily Teaching?
Data shouldn't mean more testing or endless piles of paper. It means capturing the micro-signals that occur naturally in a classroom every day.
When a teacher logs a short weekly quiz, an assignment completion rate, or an attendance trend, those individual data points connect into a clear story.
| Decision Dimension | Traditional Intuition-Based | Data-Driven Intelligence |
| Pacing Strategy | Rigid, calendar-bound syllabus pacing | Dynamic pacing adjusted to class mastery rates |
| Resource Allocation | Generic extra classes for entire grades | Targeted support groups for specific sub-concepts |
| Parent Discussions | Subjective feedback based on recent memory | Objective growth trends with clear action points |
| Department Reviews | High-level summary averages | Granular visibility into specific topic bottlenecks |
By reviewing this continuous narrative, Ocoviz equips school leaders with executive dashboards that transform raw scores into clear action items. Instead of calling a general meeting to ask why math scores are down, a principal can point directly to the specific chapter or prerequisite concept causing the bottleneck.
"Data isn't meant to judge a teacher's performance or label a child—it is meant to illuminate the exact bridge between where learning stopped and where instruction needs to resume." — State of School Intelligence in India Report
Why Does Centralized Data Reduce Teacher Burnout?
A common objection to data-driven decision-making is that teachers are already overwhelmed. Asking them to become full-time data analysts or spend hours filling out spreadsheets will only accelerate burnout.
This happens when schools use broken, fragmented software. When teachers have to enter the same marks in three different registers and compile their own charts, technology becomes a burden.
When an integrated system handles the heavy lifting, data collection happens seamlessly in the background. Teachers log an assessment once, and the platform updates student profiles, parent dashboards, and school-wide trend views automatically. To see how this saves time in practice, read our guide on how learning intelligence supports teachers without replacing them.
Practical Takeaways for School Leaders
- Audit your current feedback loop: Measure how many days pass between a student struggling with a concept and the school notifying their parents.
- Focus on micro-signals: Track weekly assignment timing and short quiz scores rather than relying solely on major quarterly exams.
- Replace static spreadsheets: Move your department heads away from manual Excel ledgers and onto a single, real-time analytics view.
- Normalize data discussions: Structure weekly staff check-ins around objective performance trends rather than subjective opinions.
Conclusion
Great school leadership has never been about having all the answers—it is about having the right visibility.
When you replace guesswork with clear, continuous performance data, you give your teachers the clarity they deserve, protect your students from falling through the cracks, and build a resilient culture where every academic decision rests on a solid foundation.
Frequently Asked Questions
How can school leaders use performance data to improve board exam results?
Why is continuous diagnostic data better than traditional term-end report cards?
How do learning analytics platforms prevent teacher burnout from data entry?
Can a school integrate performance data tracking without replacing its current ERP?
How does data-driven decision-making improve parent-teacher meetings?
What key metrics should a principal track on an executive school dashboard?
Experience Data-Driven School Leadership with Ocoviz
Discover how a centralized learning analytics platform removes administrative guesswork, supports your teaching staff, and improves student outcomes.
Explore Executive Analytics Features