The School Data Maturity Index: Score Your Institution Across 5 Stages
Key Takeaways
- 91% of school data remains purely historical, meaning leadership reviews student outcomes long after intervention windows close.
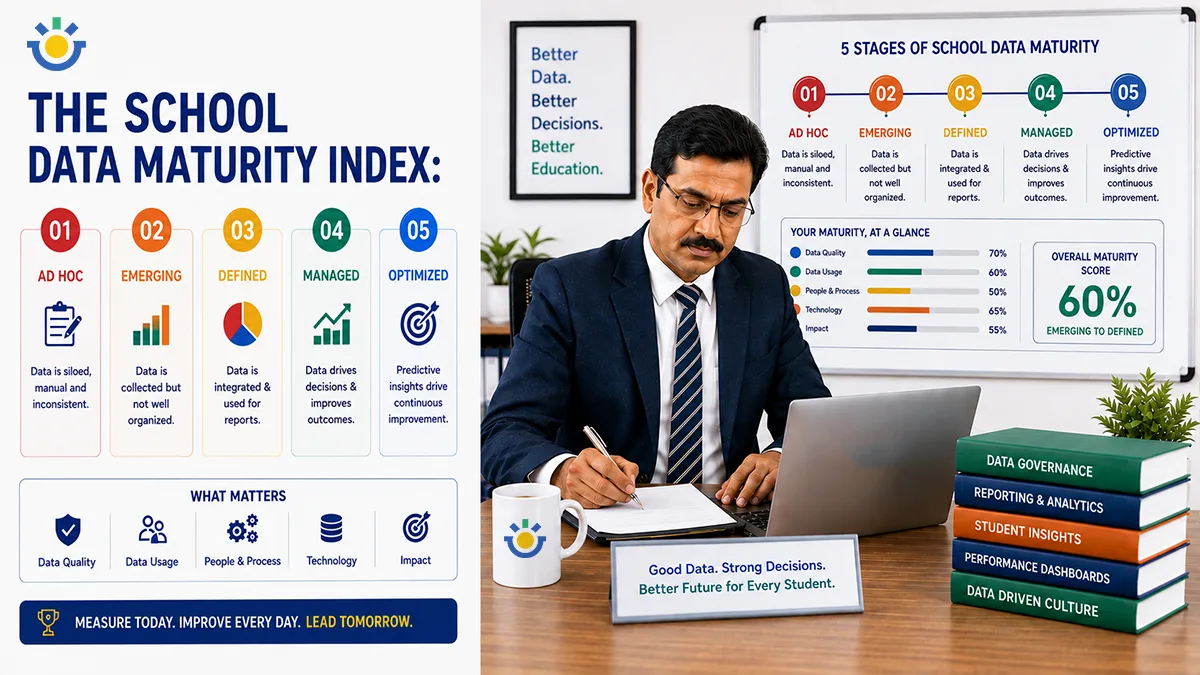
- The School Data Maturity Index outlines five progressive stages: Recording, Digitising, Unifying, Detecting, and Intervening.
- Most Indian schools stall at Stage 2 (Digitising), mistaking basic cloud ERP record-keeping for actionable educational analytics.
- Stage 4 introduces a 14-day detection window where subtle attendance drops or test dips flag academic risk before term exams.
- True data maturity requires a shift from passive reporting to Stage 5 closed-loop intervention with assigned accountability.
Walk into any modern school office, and you will likely see sleek glass cabins, high-speed Wi-Fi routers, and administrative staff managing cloud software. On paper, everything looks digital.
Now, ask the academic coordinator a simple question: "Which twenty students in Class 8 are on track to drop a full grade level by the end of this term, and who is actively working with them this week?"
Silence usually follows. Someone might offer to run a report, pull up past mark sheets, or check with class teachers by Friday.
This delay highlights a clear reality in K–12 education: having lots of stored data is not the same as having actionable insight. According to the State of School Intelligence in India 2026, an overwhelming 91% of data captured in Indian schools is purely historical. It documents academic performance after the term ends, long after the chance to intervene has passed.
Moving beyond historical record-keeping is not about buying more software—it is about evolving your school’s data maturity.
The Direct Answer
The School Data Maturity Model evaluates how effectively an educational institution converts daily operational entries into early interventions. While most schools remain stuck at Stage 2 (Digitising), true data maturity requires integrating attendance, behavior, and academic metrics into a single system that detects student risk early.
Quick-Scan Parameter
| Maturity Stage | Core System & Format | Operational Paradigm | Primary Limitation / Friction |
| Stage 1: Recording | Physical registers, paper mark sheets | Paper-based archive | Data is siloed, fragile, and slow to access |
| Stage 2: Digitising | Legacy Cloud ERP, spreadsheets | Faster digital storage | Data remains fragmented across separate modules |
| Stage 3: Unifying | Centralized student database | Interconnected profiles | Provides visibility, but relies on manual analysis |
| Stage 4: Detecting | Automated risk engines | Pattern recognition | Identifies risk trends, but lacks structured follow-up |
| Stage 5: Intervening | Predictive learning engine | Closed-loop intervention | Requires ongoing team training and operational discipline |
Why Historical Data Is a Maturity Problem, Not a Software Problem
Most school leaders assume that purchasing a modern ERP system automatically makes their institution data-driven. Yet, administrative teams often spend hours copying attendance records and test scores from one digital portal into another spreadsheet.

When data only lives in historical reports, it behaves like an autopsy—explaining why a student failed after the report card is printed. A mature school model functions more like a health monitor, spotting small warning signs early enough to change the outcome.
Stage 1, Recording: The Register, the Mark Sheet, the File Cabinet
At Stage 1, school operations rely entirely on paper archives.
- How it works: Attendance is marked in paper registers, test marks are handwritten in teacher logs, and student records sit in physical steel cabinets.
- The friction: Information lives in isolated physical spaces. If a coordinator wants to cross-reference a student's attendance history against their math scores over three terms, someone has to locate three separate physical files.
Stage 2, Digitising: The Same Records, Faster
Stage 2 replaces physical paper with digital screens, but leaves traditional processes unchanged.
- How it works: Teachers enter daily attendance using a mobile app, and staff record exam marks into cloud software.
- The Indian ERP trap: This is where the vast majority of Indian K–12 schools stop. While records are stored in the cloud, attendance modules, fee software, and academic gradebooks remain isolated from one another. The data is digital, but it remains fragmented.
Stage 3, Unifying: One Student, One Profile
Stage 3 marks a key structural shift: information from different departments connects within a single, unified database.
- How it works: The school creates a single, comprehensive profile for every student. When a pupil drops three consecutive days of school, the system automatically correlates that absence with their recent scores in an Academic Tracker.
- The breakthrough: Leadership stops reviewing disconnected departmental reports and starts analyzing holistic student profiles.
Stage 4, Detecting: Patterns Visible Before Results (The 14-Day Window)
Stage 4 introduces automated monitoring tools that spot subtle performance patterns across student groups.

- How it works: Instead of waiting for terminal exams, automated diagnostic rules flag early warning signs—such as a 12% drop in weekly quizzes combined with consecutive Monday absences.
- The 14-day window: Educators gain a crucial two-week window to support struggling students before learning gaps widen into failing grades.
Stage 5, Intervening: Closed-Loop Accountability
At Stage 5, data insights directly trigger assigned human actions.
- How it works: An automated flag automatically assigns a specific support task to an educator. For example, if a student struggles with algebra concepts, the system routes a task to the department head via an Assessment Hub to schedule targeted practice within 48 hours.
- Closed-loop accountability: Every flagged risk requires a clear action plan, an assigned owner, and a follow-up date to measure whether the intervention worked.
C. The Self-Assessment Matrix
Score your institution across the twenty criteria below. Award your school 1 Point for every statement that is fully operational today.

Stage 1: Recording Foundations
- [ ] Daily attendance is marked in physical paper registers before central entry.
- [ ] Subject teachers maintain individual gradebooks that are not accessible digitally.
- [ ] Parent communication relies primarily on physical diary notes or printed circulars.
- [ ] End-of-term report cards require manual mark collation by class teachers.
- [ ] Historical student records over three years old are stored in paper file archives.
Stage 2: Digital Entry & Storage
- [ ] Teachers enter daily attendance through a cloud portal or mobile application.
- [ ] Term exam marks are entered directly into a digital portal by subject teachers.
- [ ] Parents can view fee receipts and basic mark sheets through a mobile app.
- [ ] Administrative teams export spreadsheet reports for monthly leadership reviews.
- [ ] Departmental software modules (e.g., fees, library, marks) require separate logins.
Stage 3: Unified Data Integration
- [ ] Every student has a single digital profile linking attendance, grades, and discipline.
- [ ] Academic coordinators can view multi-year performance trends without combining files.
- [ ] Attendance drops automatically notify academic coordinators alongside class teachers.
- [ ] Leadership reviews cross-departmental dashboards rather than isolated reports.
- [ ] Multi-branch institutions compare campus metrics using centralized dashboards like Multi-Campus Analytics.
Stage 4: Pattern Detection & Risk Analysis
- [ ] The system automatically flags students showing academic decline before term exams.
- [ ] Attendance anomalies trigger automated alerts within 48 hours of occurrence.
- [ ] Diagnostic systems evaluate learning gaps down to specific concept topics.
- [ ] Early warning frameworks like Risk Radar identify at-risk students automatically.
- [ ] Subject heads receive weekly reports summarizing learning trends across classes.
Stage 5: Predictive Interventions
- [ ] System flags automatically assign support tasks to specific teachers with deadlines.
- [ ] Every academic intervention tracks a pre- and post-support performance score.
- [ ] Teachers record personalized support notes directly inside the student's central profile.
- [ ] Leadership reviews weekly intervention completion rates across departments.
- [ ] Qualified schools benchmark operational standards using the Ocoviz Smart School Badge.
Moving Up One Stage: What Works vs. What Doesn't

- To move from Stage 2 to Stage 3: Stop buying standalone software for individual departments. Consolidate your attendance, assessment, and administrative data into a single, unified database.
- To move from Stage 3 to Stage 4: Establish clear performance threshold rules. Configure automated alerts that flag whenever a student's attendance drops by 10% or their quiz scores decline across two consecutive tests.
- To move from Stage 4 to Stage 5: Focus on operational discipline. Ensure every system-generated alert generates a assigned task for an educator, complete with a clear follow-up target date.
The Reality Gap in School Leadership
When surveying school management teams, an uncomfortable trend emerges: most trustees and principals rate their school one to two stages higher than their actual day-to-day operations reflect.
Buying modern software creates the illusion of technological maturity. However, true maturity is measured by how quickly information leads to real support for a struggling student in the classroom.
Strategy Comparison: Key Milestones Across the 5 Data Maturity Stages
| Maturity Stage | Data Storage & Format | Primary User Focus | Primary Metric Tracked | Key Strategic Benefit |
| Stage 1: Recording | Paper registers & physical files | Administrative clerks | Historical attendance count | Low technology cost |
| Stage 2: Digitising | Legacy cloud ERP & spreadsheets | Data entry operators | End-of-term pass percentages | Faster record retrieval |
| Stage 3: Unifying | Integrated database | Academic coordinators | Student profile trends | Reduced departmental siloes |
| Stage 4: Detecting | Automated risk tracking | Department heads | Early performance drops | 14-day early warning window |
| Stage 5: Intervening | Predictive learning engine | Teachers & support teams | Intervention success rates | Closed-loop student support |
Frequently Asked Questions
What is a school data maturity model?
Why are most Indian schools stuck at Stage 2 of data maturity?
What is the difference between digitized data and unified data in schools?
How does a predictive data model help prevent student academic failure?
How long does it take for a school to move from Stage 2 to Stage 4 maturity?
Does achieving Stage 5 data maturity require hiring dedicated data analysts?
Measure and Upgrade Your School’s Data Maturity Stage
Discover how Ocoviz transforms fragmented school records into a predictive student support system.
Request a Data Maturity Assessment